In a previous post, I scraped 268 election observation final reports from organizations such as the European Union, the Organization for Security Cooperation in Europe, the National Democratic Institute, and the International Republican Institute. These reports were from election observation missions in 100 countries.
How easy would it be to map every country where election monitors observed elections? Pretty easy as it turns out!
#load packages
library(tidyverse)
library(rvest)
library(magrittr)
library(ggmap)
library(hrbrthemes)

#load the world map data and exclude Antarctica
world <- map_data("world")
world <- world[world$region != "Antarctica", ]

#group the countries and years from my tidy_reports data and count how many elections each year
elections_year <- tidy_reports %>%
  group_by(country, year) %>%
  summarise(no_elections = n_distinct(year)) %>%
  arrange(desc(no_elections))


#check which countries the world map and my dataset have in common
common <- intersect(elections_year$country, world$region)

common

 [1] "Afghanistan"  "Albania"      "Algeria"      "Angola"       "Armenia"
 [6] "Austria"      "Azerbaijan"   "Bahrain"      "Bangladesh"   "Belarus"
[11] "Bhutan"       "Bulgaria"     "Cambodia"     "Canada"       "China"
[16] "Croatia"      "Cyprus"       "Ecuador"      "Egypt"        "Estonia"
[21] "Ethiopia"     "Fiji"         "France"       "Gambia"       "Georgia"
[26] "Germany"      "Ghana"        "Greece"       "Honduras"     "Hungary"
[31] "Iceland"      "Indonesia"    "Jordan"       "Kazakhstan"   "Kenya"
[36] "Kosovo"       "Latvia"       "Lebanon"      "Liberia"      "Libya"
[41] "Lithuania"    "Macedonia"    "Malawi"       "Maldives"     "Malta"
[46] "Mexico"       "Moldova"      "Monaco"       "Mongolia"     "Montenegro"
[51] "Morocco"      "Mozambique"   "Myanmar"      "Nepal"        "Netherlands"
[56] "Nicaragua"    "Nigeria"      "Norway"       "Pakistan"     "Paraguay"
[61] "Peru"         "Poland"       "Romania"      "Russia"       "Rwanda"
[66] "Serbia"       "Slovenia"     "Spain"        "Sudan"        "Switzerland"
[71] "Tajikistan"   "Tanzania"     "Tunisia"      "Turkey"       "Turkmenistan"
[76] "Uganda"       "Ukraine"      "Uzbekistan"   "Venezuela"    "Yemen"
[81] "Zambia"
Only 81/100 countries matched. I suspected I had a problem with the spelling of the countries in my data or the countries were not in the world dataframe. At any rate, I needed to recode a good number of the countries in order to the join to dataframes.
#recode the spelling of countries that didn't match
elections_year$country <- recode(elections_year$country,
                                    "Guineabissau" = "Guinea-Bissau",
                                    "Bih" = "Bosnia and Herzegovina",
                                    "Srilanka" = "Sri Lanka",
                                    "Southafrica" = "South Africa",
                                    "Czech" = "Czech Republic",
                                    "Sierraleone" = "Sierra Leone",
                                    "Timor" = "Timor-Leste",
                                    "Kyrgyz" = "Kyrgyzstan",
                                    "Westbank" = "West Bank",
                                    "Elsalvador" = "El Salvador",
                                    "Philippine" = "Philippines",
                                    "Southsudan" = "South Sudan",
                                    "United States" = "USA",
                                    "Lebanese" = "Lebanon",
                                    "Slovak" = "Slovakia",
                                    "Somaliland" = "Somalia",
                                    "Hondura" = "Honduras",
                                    "Britain" = "UK")
Only two elections from my dataset were not in the world map: Somaliland and the West Bank. I recoded Somaliland as Somalia and the West Bank is not in the world map data. I then joined the election data with the map data.
joined_map <- left_join(world, elections_year, by = c("region" = "country"))
Next, I created a variable, called election_flag to indicate that the country had an election observation mission if the year variable had an observation.
joined_map <- joined_map %>% mutate(election_flag = ifelse(is.na(year),F,T))
Finally, I plotted the map.
ggplot() +
geom_cartogram(data = joined_map, map = joined_map,
aes(x = long, y = lat, map_id = region, group = group, fill = election_flag)) +
scale_fill_manual(values = c("#f0f0f0","#1d91c0")) +
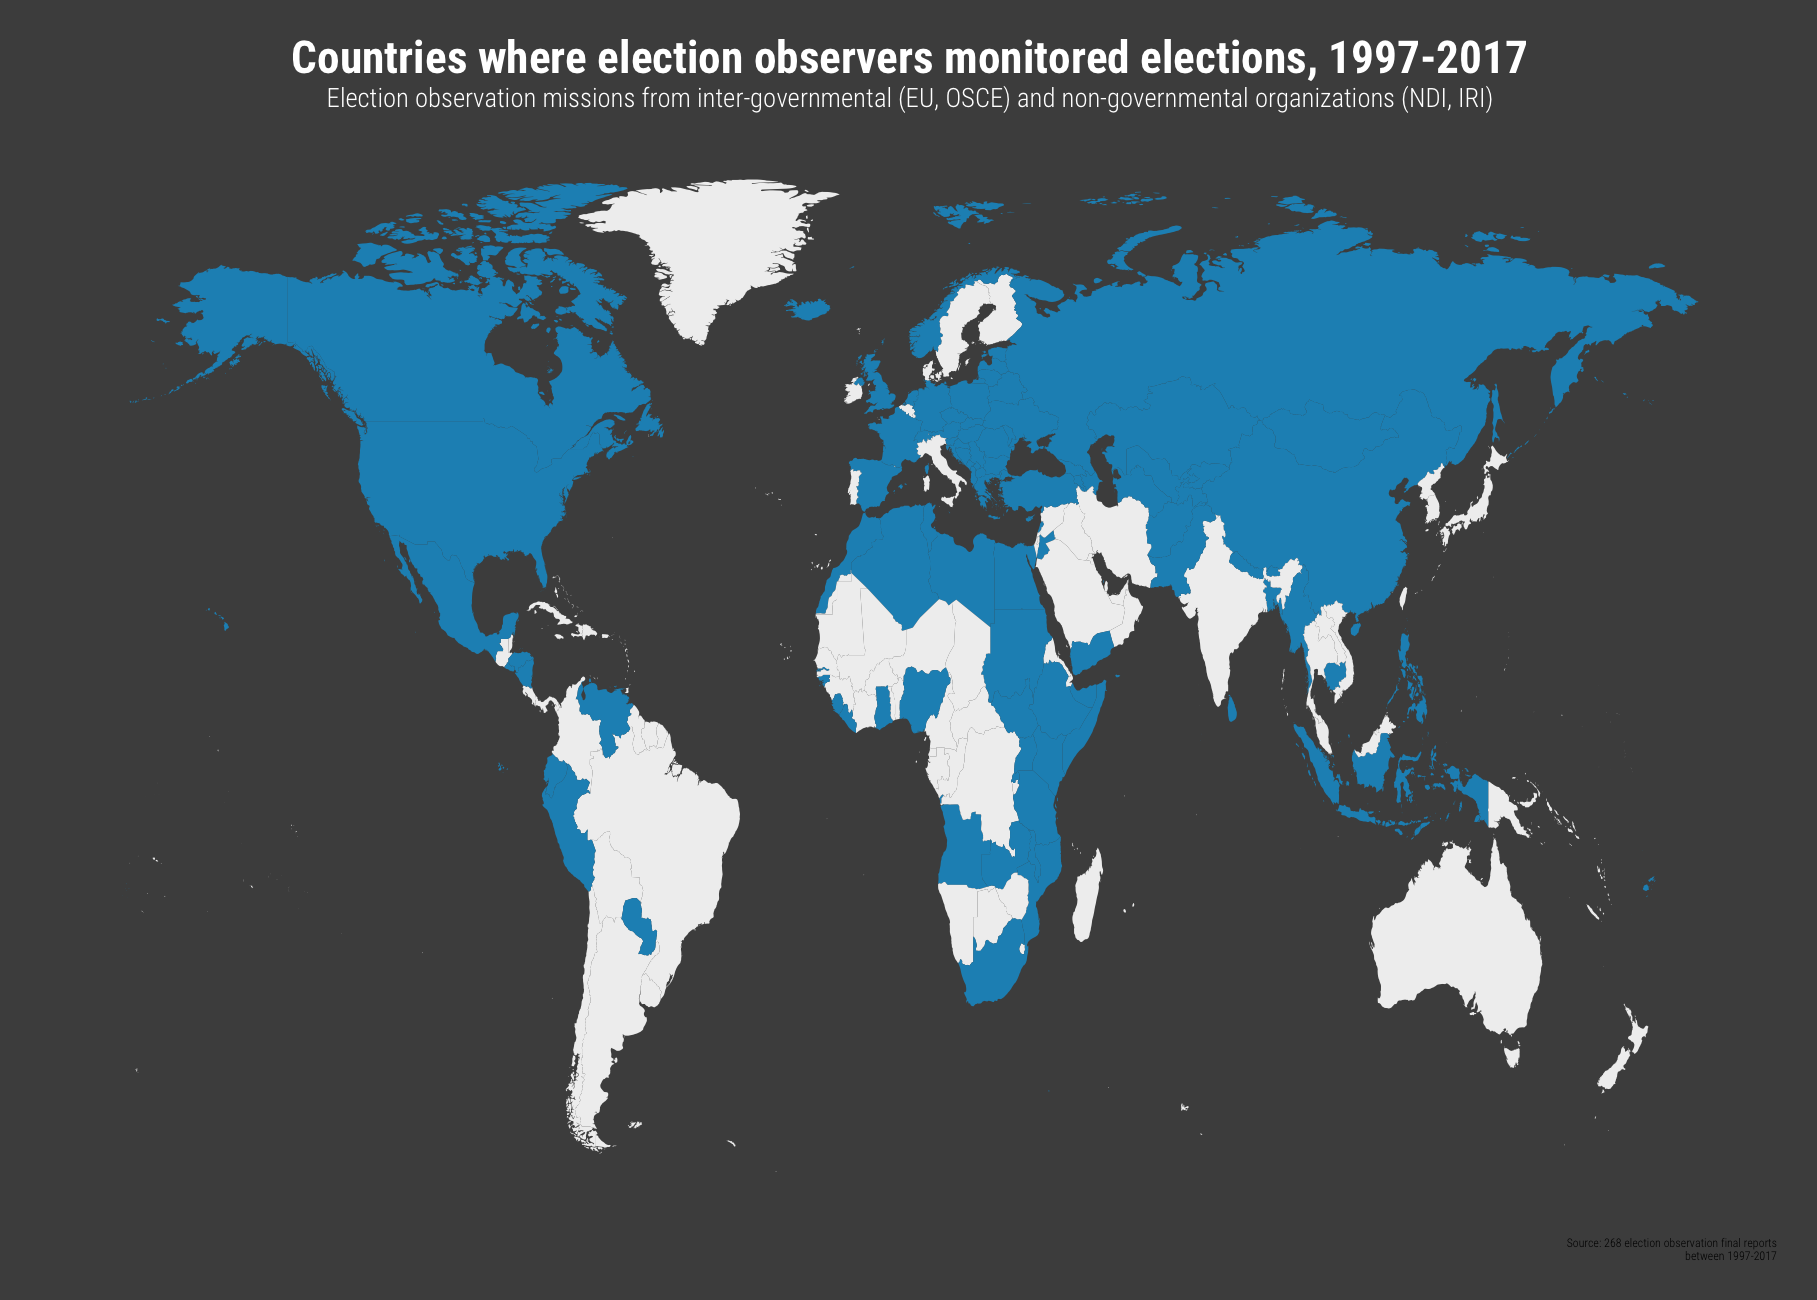
labs(title = "Countries where election observers monitored elections, 1997-2017",
subtitle = "Election observation missions from inter-governmental (EU, OSCE) and non-governmental organizations (NDI, IRI)",
caption = "Source: 268 election observation final reports\nbetween 1997-2017") +
theme_ipsum_rc(plot_title_size = 34, subtitle_size = 20) +
theme(plot.title = element_text(color = "#FFFFFF", hjust = 0.5)) +
theme(plot.subtitle = element_text(color = "#FFFFFF", hjust = 0.5)) +
theme(panel.grid = element_blank()) +
theme(plot.background = element_rect(fill = "#4d4d4d", color = "#4d4d4d")) +
theme(panel.background = element_rect(fill = "#4d4d4d",color = "#4d4d4d")) +
theme(axis.text = element_blank()) +
theme(axis.ticks = element_blank()) +
theme(axis.title = element_blank()) +
theme(legend.position = "none")
